지난 포스팅 때 R의 기본명령어와 데이터의 빈도, 백분율을 구하는 방법을 간단히 알아보았다!
이번에는 데이터를 기반으로 그래프를 그려주는 함수들에 대해서 포스티잉~
먼저 첫번째는 막대그래프 - Bar Plot (질적자료에 사용됨)
# barplot(frequency or percent)
함수는 위와 같이 barplot을 이용하면 되는데, 값으로 데이터의 빈도나 백분율을 주면 된다!
간단하게 몇가지 함수 예제를 보여주면,
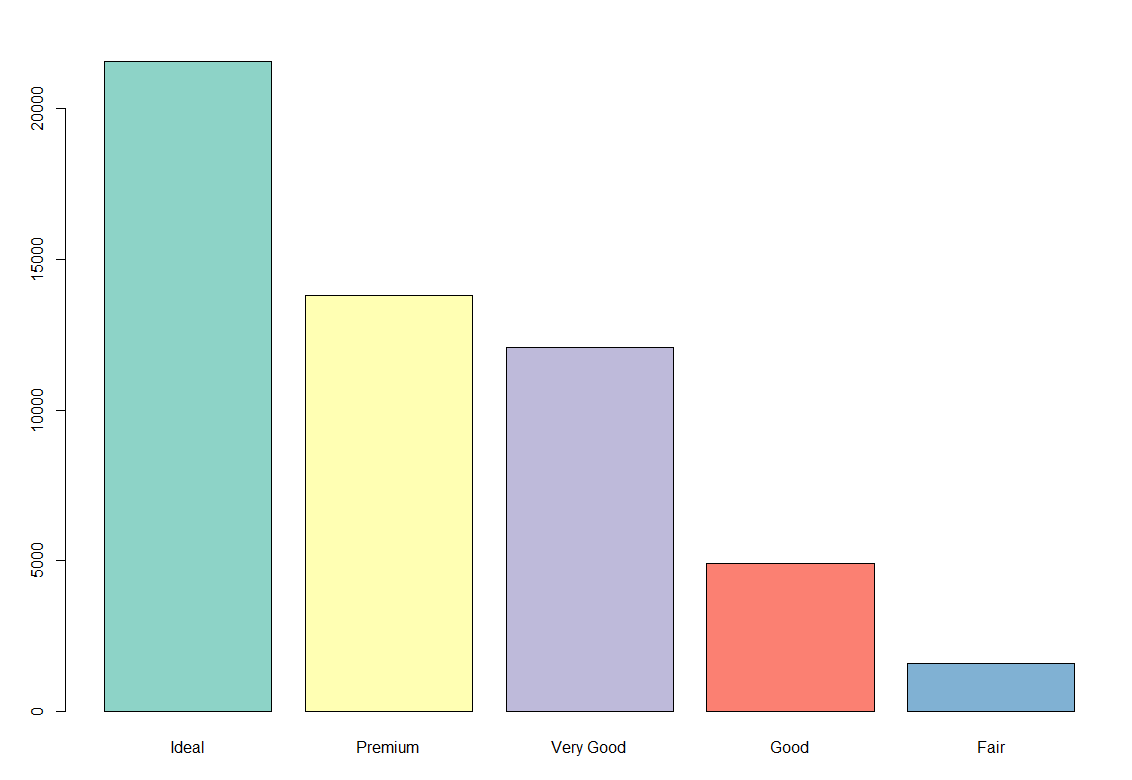
barplot(sort(table(diamonds$cut) , decreasing = TRUE)) -> cut의 빈도를 내림차순으로 막대그래프를 이용해 보여주기

barplot(sort(table(diamonds$cut) , decreasing = TRUE), col="yellow") -> 막대 컬러 설정

barplot(sort(table(diamonds$cut) , decreasing = TRUE), col=c("yellow", "skyblue", "pink","green","orange"))

정말 너무 쉽다~!
색을 다양하게 하고 싶다면 R 내장 패키지인 RColorBrewer를 이용하장
brewer::pal 함수를 이용해서 사용하고자하는 색상 수(n)과 팔레트 이름을 지정해주면 다양한 색을 사용할 수 있다.ㅎㅎ
팔레트는 명령어를 통해서 확인이 가능하다.
install.packages("RColorBrewer")
library(RColorBrewer)
display.brewer.all(n=10, exact.n=FALSE)

이렇게 pal 변수에 컬러를 넘겨주고, barplot으로 확인할 때 col에 해당 변수를 넣어주어 사용한다.
pal <- RColorBrewer::brewer.pal(n = 5, name = "Set3") barplot(sort(table(diamonds$cut) , decreasing = TRUE), col=pal)

이외에도 ㅎㅎ barplot에서 사용할 수 있는 여러가지 옵션들에 대해서 아래에 설명해놓았다.
# 차트 제목 넣기 : main = "title"
barplot(sort(table(diamonds$cut) , decreasing = TRUE),
col = pal,
main = "cut of diamonds")
# Y축 제목 넣기 : ylab = "y's title"
barplot(sort(table(diamonds$cut) , decreasing = TRUE),
col = pal,
main = "cut of diamonds",
ylab = "Frequency")
# X축 제목 넣기 : xlab = "x's title"
barplot(sort(table(diamonds$cut) , decreasing = TRUE),
col = pal,
main = "cut of diamonds",
ylab = "Frequency",
xlab = "Cut")
# Y축 눈금 넣기 : ylim = c(min, max)
barplot(sort(table(diamonds$cut) , decreasing = TRUE),
col = pal,
main = "cut of diamonds",
ylab = "Frequency",
xlab = "Cut",
ylim = c(0,25000))
세로막대를 가로막대로 변형하기 위해서는 horiz 옵션을 주어 사용한다!
# 가로 막대 그래프 : horiz = TRUE
barplot(sort(table(diamonds$cut) , decreasing = FALSE),
col = pal,
main = "cut of diamonds",
xlab = "Frequency",
ylab = "Cut",
xlim = c(0,25000),
horiz = TRUE)
여러 컬럼의 가로막대를 보려면 for문을 이용해서 확인한다.
# 3개의 가로막대 그래프 그리기
for ( i in c("cut", "color", "clarity")) {
barplot(sort(table(diamonds[,i]) , decreasing = FALSE),
col = pal,
main = stringr:::str_to_title(paste(i, "of Diamonds")),
xlab = "Frequency",
ylab = "Cut",
xlim = c(0,25000),
horiz = TRUE)
}
(2) 원그래프 - Pie Chart
원그래프는 말그래도 원모양으로 빈도를 보여주는 그래프이다!
# 참고 : 질적 자료의 값이 5개 이상이면 막대, 5개 이하면 원그래프
# pie(freqeuncy or percent)
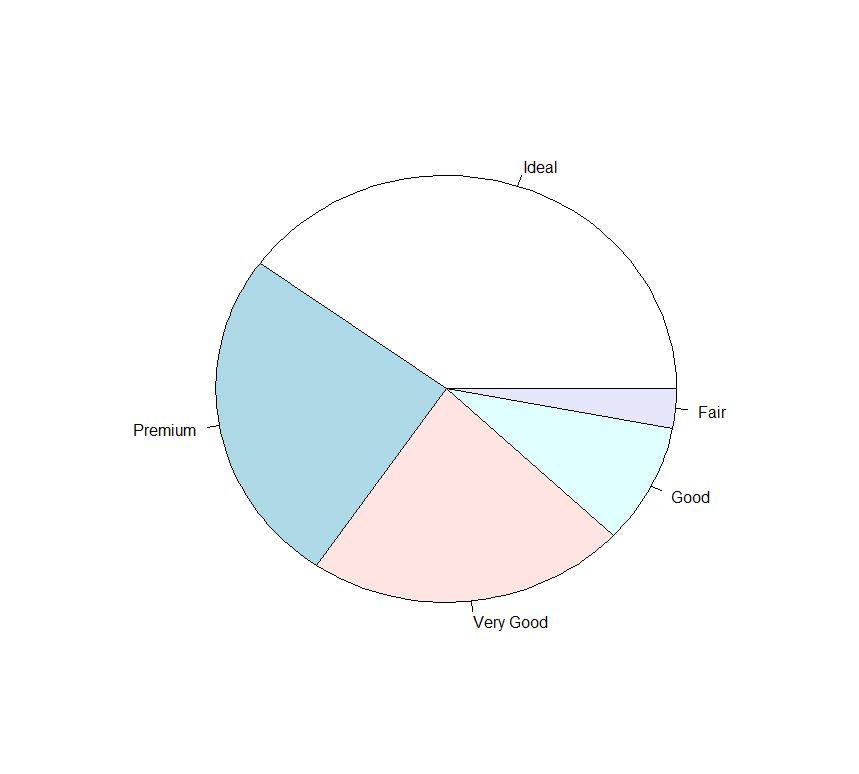
pie(sort( prop.table(table(diamonds$cut))*100 , decreasing = TRUE))
pie 함수를 이용해서 나타낼 수 있으며, 나는 다이아몬드 cut 속성에 대해 반시계 방향으로 내림차순
정렬로 빈도를 표현했다.

이외에도 반지름, 시계/반시계 방향, 시작각도 등의 여러 옵션을 줄 수 있다
# 반지름 : radius = 0.8 (디폴트값)
pie(sort( prop.table(table(diamonds$cut))*100 , decreasing = TRUE),
radius = 0.5)
# 시계방향 : clockwise = TRUE
pie(sort( prop.table(table(diamonds$cut))*100 , decreasing = TRUE),
radius = 1,
clockwise = TRUE)
# 첫째 조각의 시작 각도 : init.angle =
# 시계방향 : init.angle = 90
# 반시계방향 : init.angle = 0
pie(sort( prop.table(table(diamonds$cut))*100 , decreasing = TRUE),
radius = 1,
clockwise = TRUE,
init.angle = 90)
# 3개의 가로막대 그래프 그리기 ----
for ( i in c("cut", "color", "clarity")) {
pie(sort( prop.table(table(diamonds[,i]))*100 , decreasing = TRUE),
radius = 1,
clockwise = TRUE,
init.angle = 90,
main = stringr:::str_to_title(paste(i, "of Diamonds")))
}
# 가로막대 + 원 그래프 그리기
for ( i in c("cut", "color", "clarity")) {
barplot(sort(table(diamonds[,i]) , decreasing = FALSE),
col = pal,
main = stringr:::str_to_title(paste(i, "of Diamonds")),
xlab = "Frequency",
ylab = "Cut",
xlim = c(0,25000),
horiz = TRUE)
pie(sort( prop.table(table(diamonds[,i]))*100 , decreasing = TRUE),
radius = 1,
col = pal,
clockwise = TRUE,
init.angle = 90,
main = stringr:::str_to_title(paste(i, "of Diamonds")))
}
for문을 돌려서 확인할 때에 한 화면에 하나의 그래프만 보여서 확인이 어렵다면,
아래 명령어로 화면을 분할하여 확인하면 된다.!
# 그래픽 화면 분할하기 ----
# par(mfrow = c(nrow, ncol)) - 행을 먼저 채운다
# par(mfcol = c(nrow, ncol)) - 열을 먼저 채운다
par(mfrow = c(3,2))
위 명령은 실행 이후 모든 것에 적용되기 때문에 다시 한 화면에 하나의 그래프만 확인하고 싶을때는
아래 명령어를 다시 실행해 주어야 한다 !

par(mfrow = c(1,1))
'IT' 카테고리의 다른 글
| [R programming] 재미로 알아보는 카카오톡 대화 분석 (0) | 2019.07.06 |
|---|---|
| [R Programming] 정규성 검정 - Shapiro-Wilks test (0) | 2019.07.06 |
| R을 활용한 빅데이터 고급 분석 (0) | 2019.06.03 |
| [R Programming] - 기본 명령어 및 데이터 불러오기 (0) | 2019.05.26 |
| [네트워크] 공인 IP 사설 IP (0) | 2019.02.03 |


댓글